Chapter 6 6. Access results
The results are all stored in the list object outputted from the function. In this case we named it DE_out. The following functions are helper functions to allow you to extract the results for viewing. If you are familiar with lists in R you may also be comfortable looking through the DE_out manually.
The following results are most important for determining the quality of the analysis. Interpretation is beyond the scope of this book, but please read the DESeq2 Vignette carefully as there is substantial amounts of information and it is kept updated by the package authors: http://bioconductor.org/packages/devel/bioc/vignettes/DESeq2/inst/doc/DESeq2.html.
The DE4Rumi packages includes many GET_ functions, all with the purpose of accessing different results from the DE output:
GET_boxplot_cooks_distanceGET_dds_wald_objectsGET_DE_by_PIF_dfGET_DESeq2_res_objectGET_normalised_dataGET_overall_plotsGET_pairwise_plotsGET_PIF_df
See their help pages for detailed information.
6.1 Boxplot of cooks distances
This has own function compared to others below. This is useful for both DE comparisons and when whole data normalisation has been run.
boxplots <-
  GET_boxplot_cooks_distance(auto_DE_output = DE_out)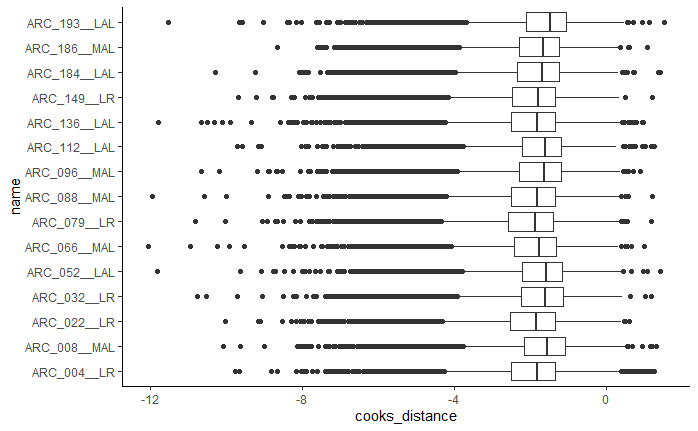
Figure 6.1: Example boxplot output
6.2 PCA
PCA_plots <-
  GET_overall_plots(auto_DE_output = DE_out,
                    type = "PCA")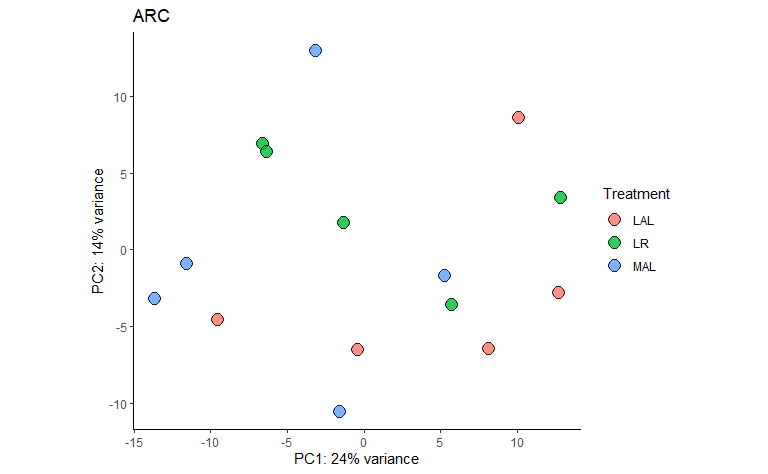
Figure 6.2: Example PCA output
6.3 Heatmap
heatmaps <-
  GET_overall_plots(auto_DE_output = DE_out,
                    type = "heatmap")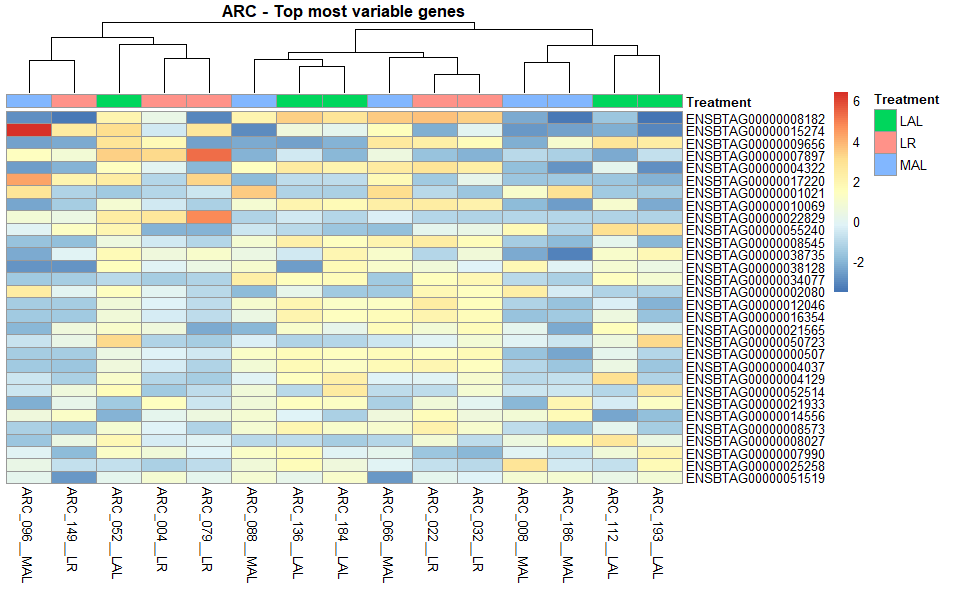
Figure 6.3: Example Heatmap output
6.4 Sample distances
sample_distances <-
  GET_overall_plots(auto_DE_output = DE_out,
                    type = "sample_distances")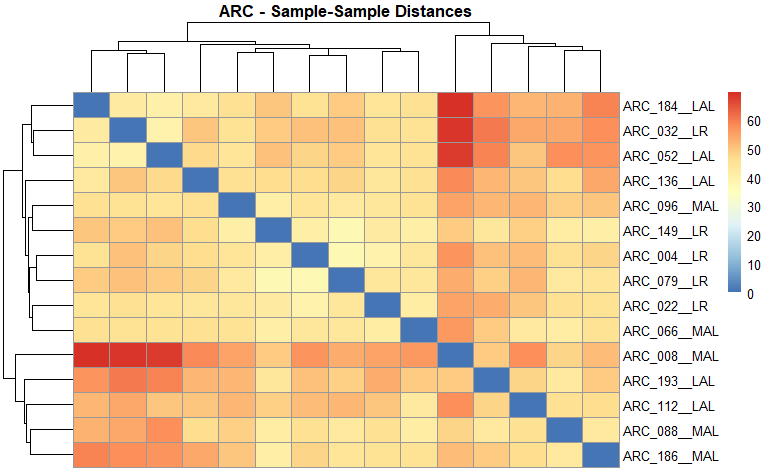
Figure 6.4: Example sample distances output
6.5 Remove outliers if needed and re-run steps DE Analysis
If you find outliers in the samples, they should be removed and the whole DE Analysis on this page re-run before proceeding.